Turn this view into work. Preserve the current source, assign an owner, and measure the outcome.Create action from this view
Financial statements
Finance
Income statement, balance sheet and the ratios that read them — the layer below the gross-margin line that the operational pages stop at.
Entity-level statements. Operational filters do not apply - a balance sheet has no region or department dimension.
All figures on this page are synthetic. Northgate Retail Group is a fictional retail group; the data is generated by seed/ and no real company's results are shown.
Income statement
Invoiced sales, gross sales, discounts and COGS are read from the sales fact, so the top line matches the Overview.
| Line | FY2024 | FY2025 | FY2026 (9 mo) | % of sales (FY2025) |
|---|---|---|---|---|
| Invoiced sales | $11,986,317 | $10,537,948 | $8,205,814 | 100.0% |
| Cost of goods sold | $9,543,082 | $8,207,276 | $6,534,403 | 77.9% |
| Gross profit | $2,443,234 | $2,330,672 | $1,671,411 | 22.1% |
| Operating expenses | $1,985,287 | $1,755,362 | $1,371,284 | 16.7% |
| Depreciation & amortisation | $132,333 | $116,003 | $89,311 | 1.1% |
| Other expense (income) | $10,558 | $3,163 | $633 | 0.0% |
| Interest expense | $66,912 | $59,283 | $45,655 | 0.6% |
| Pre-tax income | $248,144 | $396,862 | $164,528 | 3.8% |
| Income tax expense | $65,758 | $105,168 | $48,099 | 1.0% |
| Net income | $182,386 | $291,693 | $116,429 | 2.8% |
Gross to net sales
26 approved return credits are netted here.
| Gross sales | $11,042,383 |
| Less discounts | ($504,435) |
| Less return credits | ($53,445) |
| Less discount & return handling | ($8,180) |
| Net sales | $10,476,323 |
| Invoiced sales (the basis above) | $10,537,948 |
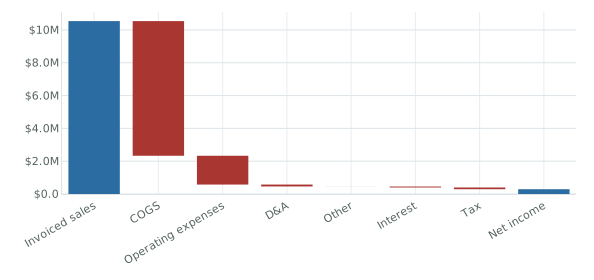
Of every dollar invoiced, 2.8% reaches net income; cost of goods takes the largest single step.
Balance sheet
Balances as at 2025-09-30. Net assets is derived as total assets less total liabilities. Assets and liabilities are modelled from independent drivers, so this is a residual rather than a retained-earnings account that rolls forward from net income.
| Cash | $138,011 |
| Accounts receivable | $906,044 |
| Inventory | $863,580 |
| Prepaid expenses | $58,309 |
| Total current assets | $1,965,945 |
| Property, plant & equipment, net | $8,337,540 |
| Intangible assets | $2,150,000 |
| Total assets | $12,453,485 |
| Accounts payable | $649,432 |
| Accrued liabilities | $73,922 |
| Current portion of debt | $1,200,000 |
| Total current liabilities | $1,923,354 |
| Long-term debt | $6,957,600 |
| Total liabilities | $8,880,954 |
| Net assets (residual) | $3,572,530 |
Receivables aging
Month-end receivable book by days past invoice.
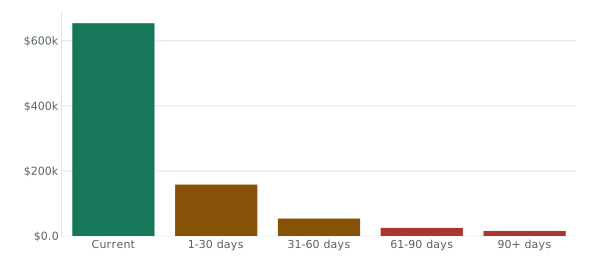
27.8% of the receivable book is past invoice date; $15,512 has aged beyond 90 days.
Monthly result
Invoiced sales against net income, with the net margin on the right axis.
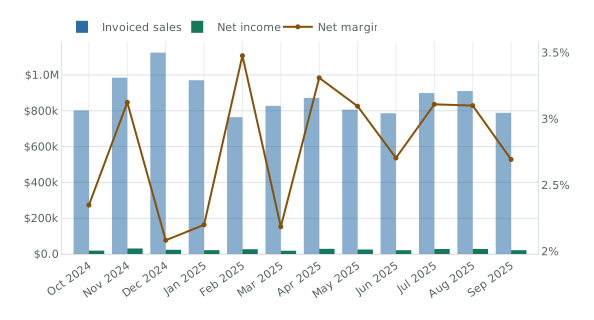
Net income ran from $18,097 to $30,777 across the year, on a margin between 2.1% and 3.5%.
Operating expense mix
Where the operating cost base sits, for the fiscal year shown.
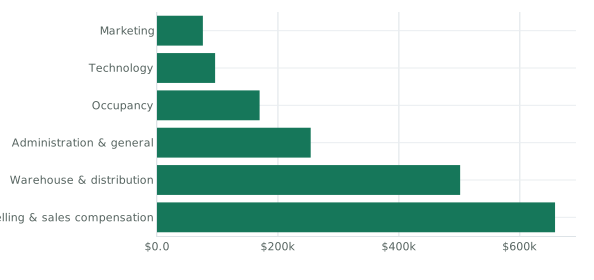
Selling & sales compensation is the largest line at 37.5% of operating expense.
Liquidity
Working capital and the current ratio, month by month across the whole dataset.
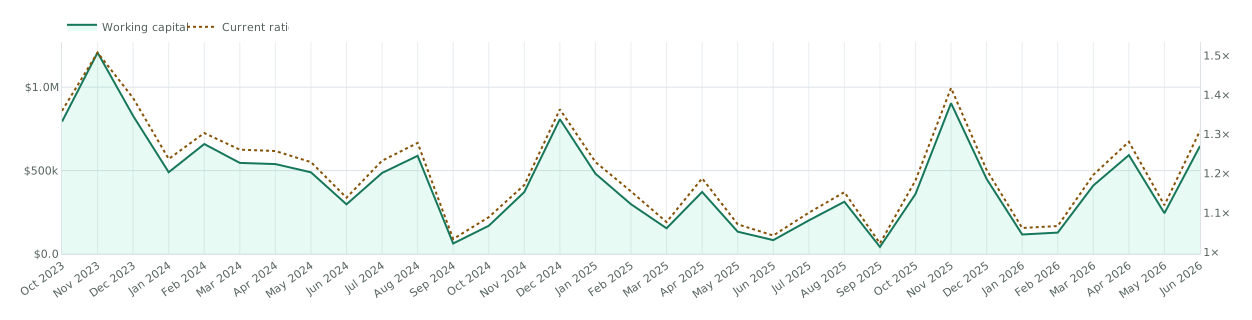
The current ratio holds between 1.02× and 1.51× across the period.
Monthly detail
FY2025 by month. Operating expenses, D&A, interest, tax and the balance sheet are a seeded financial layer. Every other figure on this page derives from them.
| Month | Invoiced sales | Gross profit | Operating expenses | Net income | Net margin | Working capital | Current ratio |
|---|---|---|---|---|---|---|---|
| Oct 2024 | $802,282 | $169,369 | $129,740 | $18,853 | 2.3% | $169,092 | 1.09× |
| Nov 2024 | $984,801 | $220,309 | $161,190 | $30,777 | 3.1% | $371,454 | 1.17× |
| Dec 2024 | $1,125,096 | $238,010 | $186,753 | $23,451 | 2.1% | $808,076 | 1.36× |
| Jan 2025 | $970,725 | $209,150 | $162,204 | $21,368 | 2.2% | $481,419 | 1.23× |
| Feb 2025 | $764,323 | $173,292 | $124,777 | $26,580 | 3.5% | $298,263 | 1.15× |
| Mar 2025 | $827,698 | $183,148 | $146,015 | $18,097 | 2.2% | $154,242 | 1.08× |
| Apr 2025 | $872,162 | $203,109 | $148,087 | $28,874 | 3.3% | $371,904 | 1.19× |
| May 2025 | $806,262 | $181,414 | $133,646 | $24,965 | 3.1% | $133,709 | 1.07× |
| Jun 2025 | $786,255 | $173,540 | $131,643 | $21,275 | 2.7% | $83,129 | 1.04× |
| Jul 2025 | $899,310 | $197,483 | $145,256 | $27,974 | 3.1% | $201,320 | 1.10× |
| Aug 2025 | $910,370 | $201,956 | $148,039 | $28,231 | 3.1% | $313,235 | 1.15× |
| Sep 2025 | $788,666 | $179,893 | $138,011 | $21,250 | 2.7% | $42,590 | 1.02× |
Operating expenses, D&A, interest, tax and the balance sheet are a seeded financial layer. Every other figure on this page derives from them. Incomplete months excluded from every figure on this page: 2026-07-01. Dataset version 1790896463000.