Demand & Supply Planner
Demand signal, replenishment reliability, and where the two disagree
Planning Position
Demand direction and delivery reliability, read together. Comparing 2026-02-16 to 2026-07-04 against 2025-10-01 to 2026-02-15.
Forecast Accuracy
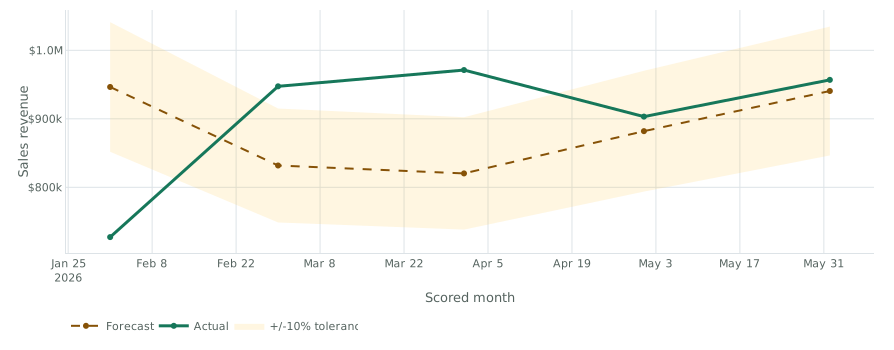
Rolling-origin backtest: each point is predicted using only history available at that origin. WAPE is the executive headline; SMAPE is the bounded secondary diagnostic. Incomplete calendar months and weeks are excluded. The shaded region is a +/-10% hit-tolerance band, not a confidence interval.
| Name | WAPE | SMAPE | Signed bias | Hit rate | Periods |
|---|---|---|---|---|---|
| 1-week horizon | 15.3% | 15.5% | $2,848.87 | 29.0% | 31 |
| 4-week horizon | 15.8% | 16.0% | $3,338.96 | 42.9% | 28 |
| 8-week horizon | 18.0% | 17.9% | $5,452.82 | 41.7% | 24 |
| Name | WAPE | SMAPE | Signed bias | Hit rate | Periods |
|---|---|---|---|---|---|
| EL-1034 | 36.9% | 33.8% | $3,066.84 | 0.0% | 5 |
| EL-1277 | 36.5% | 38.5% | $2,033.32 | 0.0% | 5 |
| EL-1151 | 39.2% | 48.4% | $526.96 | 0.0% | 5 |
| EL-1088 | 33.1% | 33.8% | -$1,638.43 | 40.0% | 5 |
| EL-1101 | 82.5% | 79.5% | $2,414.67 | 20.0% | 5 |
| EL-1297 | 36.6% | 37.4% | -$1,330.00 | 0.0% | 5 |
| HK-1204 | 45.6% | 44.6% | $3,693.01 | 0.0% | 5 |
| EL-1139 | 55.3% | 51.5% | $1,624.67 | 20.0% | 5 |
| EL-1063 | 26.6% | 27.9% | $875.57 | 60.0% | 5 |
| EL-1308 | 55.5% | 46.1% | $5,103.22 | 0.0% | 5 |
| Name | WAPE | SMAPE | Signed bias | Hit rate | Periods |
|---|---|---|---|---|---|
| Southeast | 18.6% | 19.4% | -$22,826 | 40.0% | 5 |
| Texas & Gulf | 19.1% | 19.0% | -$9,062.93 | 20.0% | 5 |
| Midwest | 19.7% | 17.8% | $21,370 | 20.0% | 5 |
| Pacific | 23.0% | 23.9% | -$10,819 | 0.0% | 5 |
| Mountain West | 12.0% | 11.8% | -$7,244.09 | 60.0% | 5 |
| Northeast | 37.0% | 40.6% | -$1,241.69 | 20.0% | 5 |
| Mid-Atlantic | 30.1% | 26.4% | $12,859 | 40.0% | 5 |
Same month prior year when available; otherwise trailing 3-month mean. Signed bias is scored at 1, 4, and 8 weeks using a trailing 4-week mean until prior-year weekly history is available. Zero actuals are included in WAPE, SMAPE, and signed bias; excluded from MAPE and hit-rate. MAPE is diagnostic only and is unreliable on low-volume series.
Demand Signal
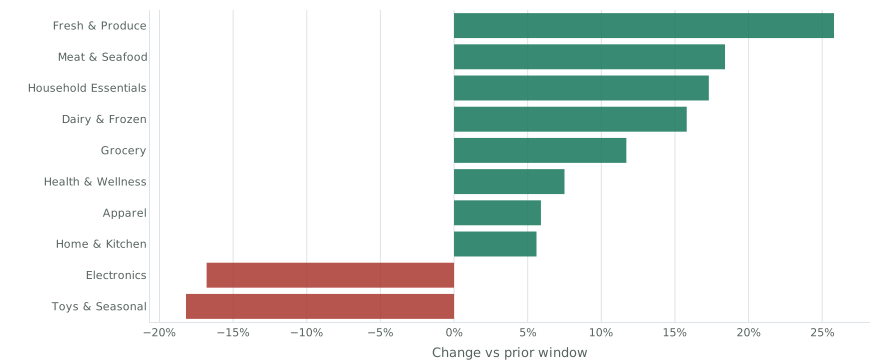
Revenue in the recent half of the window against the prior half, by department. Half-and-half rather than a fitted trend, because the window is yours to change and a slope through four points claims more than it knows.
| Department | Revenue | Share | Change | Direction |
|---|---|---|---|---|
| Electronics | $976,974 | 23.3% | ↓ 16.8% | declining |
| Health & Wellness | $667,383 | 15.9% | → 7.5% | steady |
| Grocery | $665,519 | 15.9% | ↑ 11.7% | growing |
| Home & Kitchen | $450,838 | 10.7% | → 5.6% | steady |
| Meat & Seafood | $404,721 | 9.6% | ↑ 18.4% | growing |
| Household Essentials | $265,875 | 6.3% | ↑ 17.3% | growing |
| Apparel | $234,519 | 5.6% | → 5.9% | steady |
| Fresh & Produce | $218,736 | 5.2% | ↑ 25.8% | growing |
| Dairy & Frozen | $208,245 | 5.0% | ↑ 15.8% | growing |
| Toys & Seasonal | $102,315 | 2.4% | ↓ 18.2% | declining |
Inventory & OTIF
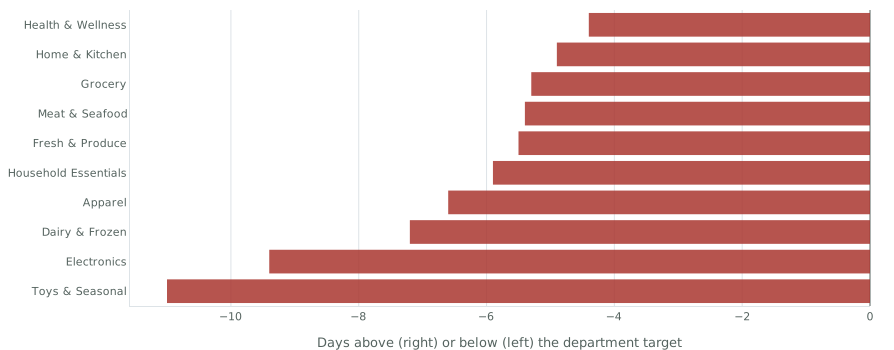
Four availability numbers, and they are not interchangeable. A lane can hit 95% on-time and 95% in-full separately and still miss one delivery in ten, which is why OTIF — on time and in full, measured on the line rather than multiplied out of the other two — is the one a store actually feels.
| Name | OTIF | Line fill | On time | Stockout | Cover | On hand | Status |
|---|---|---|---|---|---|---|---|
| Toys & Seasonal | 78% | 87% | 89% | 5.9% | 34d / 45d | $10,515 | Critical |
| Fresh & Produce | 83% | 89% | 92% | 4.4% | 9d / 14d | $5,417.00 | Below target |
| Electronics | 84% | 91% | 92% | 5.1% | 36d / 45d | $150,270 | Below target |
| Meat & Seafood | 87% | 93% | 93% | 2.1% | 9d / 14d | $5,340.80 | Below target |
| Apparel | 88% | 94% | 93% | 3.1% | 38d / 45d | $17,934 | Below target |
| Dairy & Frozen | 89% | 97% | 92% | 1.4% | 38d / 45d | $20,060 | Below target |
| Home & Kitchen | 89% | 96% | 93% | 2.1% | 40d / 45d | $46,483 | Below target |
| Health & Wellness | 90% | 97% | 92% | 1.2% | 41d / 45d | $65,971 | Below target |
| Household Essentials | 90% | 98% | 92% | 0.7% | 39d / 45d | $26,875 | Below target |
| Grocery | 90% | 98% | 92% | 0.6% | 40d / 45d | $69,589 | On target |
Cover targets differ by department on purpose: perishable lines are held to 14 days and ambient to 45, because a single chain-wide target would flag all of fresh as a problem and none of general merchandise.
| Name | OTIF | Line fill | On time | Stockout | Cover | On hand | Status |
|---|---|---|---|---|---|---|---|
| Third Party LTL | 74% | 96% | 77% | 1.6% | 35d / 45d | $396,559 | Critical |
| Vendor Drop-Ship | 84% | 95% | 88% | 2.5% | 32d / 45d | $393,040 | Below target |
| Direct Store Delivery | 89% | 95% | 93% | 1.9% | 36d / 45d | $445,666 | Below target |
| Cross-Dock | 89% | 96% | 93% | 1.7% | 33d / 45d | $453,497 | Below target |
| DC Cold Chain | 91% | 96% | 95% | 1.7% | 36d / 45d | $415,875 | On target |
| DC Ambient | 93% | 96% | 97% | 1.9% | 37d / 45d | $404,279 | On target |
- critical
Toys & Seasonal: 78% OTIF
87% of lines ship complete and 89% arrive on time, so 22% of deliveries disappoint the store on one count or the other. Median cover is 34 days against a 45-day target.
- warning
Toys & Seasonal stocks out on 5.9% of lines
Lines that filled to zero, not short. Median cover is 34 days against a 45-day target.
- warning
Electronics stocks out on 5.1% of lines
Lines that filled to zero, not short. Median cover is 36 days against a 45-day target.
- warning
Fresh & Produce stocks out on 4.4% of lines
Lines that filled to zero, not short. Median cover is 8 days against a 14-day target.
- warning
Apparel stocks out on 3.1% of lines
Lines that filled to zero, not short. Median cover is 38 days against a 45-day target.
Service Level
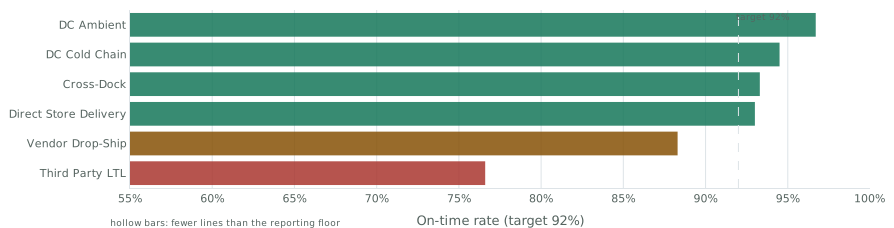
The share of order lines that arrived on or before the date they were promised. Anything under 92% is below target. Groups with fewer than 25 lines are shown but not ranked — a lane with four deliveries that missed one is not “25% late” in any useful sense.
| Name | On time | Lines | Revenue | Status |
|---|---|---|---|---|
| Third Party LTL | 76.6% | 3,644 | $1,176,174 | Critical |
| Vendor Drop-Ship | 88.3% | 1,458 | $496,792 | Below target |
| Direct Store Delivery | 93.0% | 5,251 | $1,792,055 | On target |
| Cross-Dock | 93.3% | 2,590 | $789,800 | On target |
| DC Cold Chain | 94.5% | 4,955 | $1,568,623 | On target |
| DC Ambient | 96.7% | 8,104 | $2,457,943 | On target |
| Name | On time | Lines | Revenue | Status |
|---|---|---|---|---|
| Alderwood Consumer Products | 90.7% | 742 | $404,525 | Below target |
| Redstone Brands | 90.7% | 1,006 | $587,434 | Below target |
| Alderwood Distribution | 90.9% | 1,476 | $330,341 | Below target |
| Harborview Supply Co | 91.3% | 913 | $328,033 | Below target |
| Silverbrook Foods | 91.4% | 1,015 | $247,354 | Below target |
| Stonebridge Brands | 91.4% | 1,129 | $197,826 | Below target |
| Northwind Consumer Products | 91.6% | 1,170 | $334,667 | Below target |
| Sandhill Manufacturing | 91.6% | 859 | $119,150 | Below target |
Demand vs Service
Demand growth against service level. Only one quadrant gets a colour, because only one of them means the problem grows while you look at it.
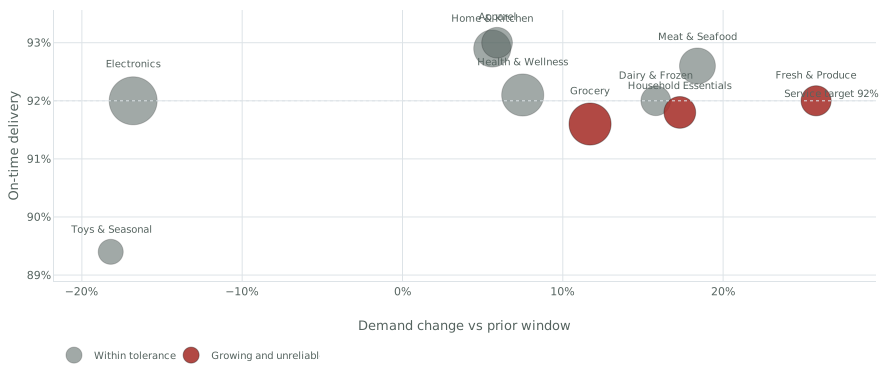
Growing, unreliable
Demand is rising into a lane that already misses its dates. Doing nothing makes this bigger, not the same size.
- Grocery↑ 11.7%·92% on time·$665,519
- Household Essentials↑ 17.3%·92% on time·$265,875
- Fresh & Produce↑ 25.8%·92% on time·$218,736
Flat, unreliable
Service is below target but demand is not compounding the problem.
- Toys & Seasonal↓ 18.2%·89% on time·$102,315
Growing, reliable
Demand is rising and the network is keeping up. Room to push.
- Meat & Seafood↑ 18.4%·93% on time·$404,721
- Dairy & Frozen↑ 15.8%·92% on time·$208,245
Flat, reliable
No action indicated.
- Electronics↓ 16.8%·92% on time·$976,974
- Health & Wellness→ 7.5%·92% on time·$667,383
- Home & Kitchen→ 5.6%·93% on time·$450,838
- Apparel→ 5.9%·93% on time·$234,519
Vendor Exposure
The largest vendor in each department, and how much of it they carry. Over 45% is single-sourced in practice, whatever the contract says — and it only matters next to that vendor's service record.
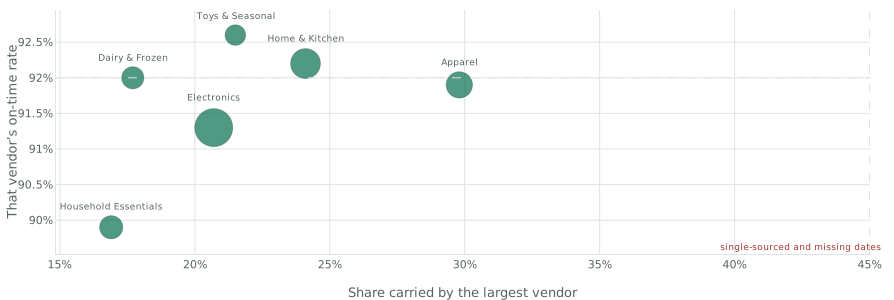
| Department | Largest vendor | Share | Vendors | Their on-time |
|---|---|---|---|---|
| Apparel | Bayfield Foods | 30% | 8 | 92% |
| Home & Kitchen | Grayrock Manufacturing | 24% | 10 | 92% |
| Toys & Seasonal | Alderwood Consumer Products | 22% | 6 | 93% |
| Electronics | Redstone Brands | 21% | 8 | 91% |
| Dairy & Frozen | Alderwood Distribution | 18% | 17 | 92% |
| Household Essentials | Grayrock Manufacturing | 17% | 16 | 90% |
What To Do
Every line here points at a figure elsewhere on this page. Ranked by what it costs to ignore, and deliberately short — a list of twenty actions is a list of none.
- critical
Grocery: demand is outrunning service
Revenue is up 12% against the prior half of the window while only 92% of its lines arrive on time. It is 16% of revenue, so the gap compounds.
- critical
Household Essentials: demand is outrunning service
Revenue is up 17% against the prior half of the window while only 92% of its lines arrive on time. It is 6% of revenue, so the gap compounds.
- critical
Fresh & Produce: demand is outrunning service
Revenue is up 26% against the prior half of the window while only 92% of its lines arrive on time. It is 5% of revenue, so the gap compounds.
- warning
Third Party LTL misses 23% of its dates
3,644 lines and $1.2M of revenue move on this lane at 77% on time, against a 92% target.
- info
Vendor Drop-Ship misses 12% of its dates
1,458 lines and $497k of revenue move on this lane at 88% on time, against a 92% target. Under target but above the critical band.