Acquisition
Marketing
What it costs to win an account, where the spend goes, and how long the account takes to repay it — the one block of the metric reference that needed a source system the sales fact does not contain.
Entity-level acquisition performance. Operational filters do not apply - a campaign has no department or region dimension.
All figures on this page are synthetic. Northgate Retail Group is a fictional retail group; the data is generated by seed/ and no real company's results are shown.
ROMI intentionally withheld.
This dataset has campaign spend, leads, and acquired-account counts, but no exposure or
incrementality source. Company-wide revenue movement is not presented as causal marketing
return. See the source requirement.
Spend against accounts won
Total acquisition spend each month, with the accounts it won and the resulting CAC.
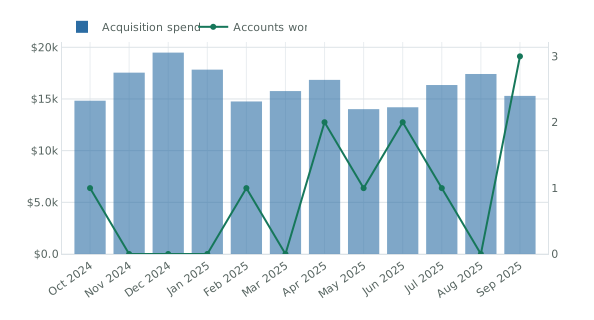
11 accounts won across the year, at a monthly CAC between $0 and $16,348.
Acquisition funnel
Leads, the share that qualified, and the accounts that closed.
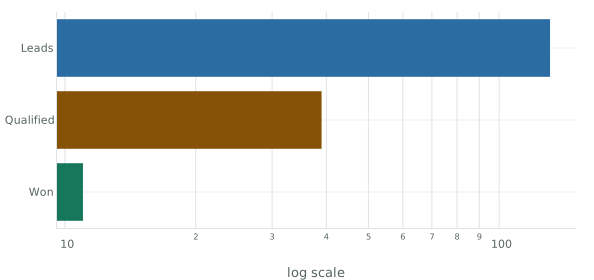
29.8% of leads qualify and 28.2% of those close — 8.4% of all leads become accounts.
Where the spend goes
Marketing spend by channel for the fiscal year shown.
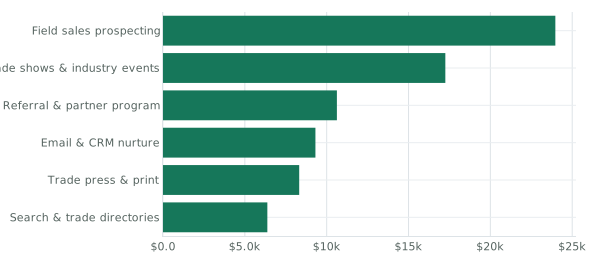
Field sales prospecting takes 31.6% of marketing spend.
Channel performance
Cost per win is marketing spend only — the selling-compensation share is a company-level split with no channel attribution behind it.
| Channel | Spend | Leads | Qualified | Won | CPL | Cost per win |
|---|---|---|---|---|---|---|
| Field sales prospecting | $23,970 | 28 | 15 | 4 | $856 | $5,993 |
| Trade shows & industry events | $17,249 | 12 | 0 | 0 | $1,437 | — |
| Referral & partner program | $10,623 | 23 | 12 | 4 | $462 | $2,656 |
| Email & CRM nurture | $9,312 | 40 | 12 | 3 | $233 | $3,104 |
| Trade press & print | $8,321 | 11 | 0 | 0 | $756 | — |
| Search & trade directories | $6,375 | 17 | 0 | 0 | $375 | — |
Monthly detail
Channel mix, lead counts and campaign attribution are modelled. Spend and new-customer counts are read from the finance layer and the sales fact.
| Month | Marketing spend | Acquisition selling | Total | Leads | Qualified | Won | CAC |
|---|---|---|---|---|---|---|---|
| Oct 2024 | $5,889 | $8,942 | $14,831 | 10 | 3 | 1 | $14,831 |
| Nov 2024 | $7,001 | $10,544 | $17,545 | 12 | 3 | 0 | — |
| Dec 2024 | $7,174 | $12,311 | $19,485 | 13 | 3 | 0 | — |
| Jan 2025 | $7,114 | $10,723 | $17,837 | 12 | 3 | 0 | — |
| Feb 2025 | $6,027 | $8,730 | $14,758 | 10 | 3 | 1 | $14,758 |
| Mar 2025 | $6,294 | $9,469 | $15,763 | 11 | 3 | 0 | — |
| Apr 2025 | $6,921 | $9,925 | $16,846 | 11 | 4 | 2 | $8,423 |
| May 2025 | $4,887 | $9,128 | $14,014 | 9 | 3 | 1 | $14,014 |
| Jun 2025 | $4,575 | $9,621 | $14,196 | 8 | 3 | 2 | $7,098 |
| Jul 2025 | $7,016 | $9,332 | $16,348 | 12 | 4 | 1 | $16,348 |
| Aug 2025 | $7,273 | $10,142 | $17,415 | 13 | 4 | 0 | — |
| Sep 2025 | $5,681 | $9,617 | $15,297 | 10 | 3 | 3 | $5,099 |
Month of each customer's first order in the sales fact Campaign spend sums to the Marketing operating-expense line in cache/finance FY2024 is the dataset's opening book: 504 of 620 customers place a first order in the first month and the eleven months after it record almost none. CAC against an opening book is meaningless, so the marketing layer starts at FY2025.