Turn this view into work. Preserve the current source, assign an owner, and measure the outcome.Create action from this view
Regional Command Center
Regions Performance
Revenue, profit, concentration, retention, and momentum across the active filtered regions.
Oct 1, 2025 – Jul 4, 2026Regions in scope: 7Customers in scope: 96Orders in scope: 4,184Packs coverage: 100%Cost coverage: 100%Freshness: 89d lag
Total Revenue
$8,281,387
4,184 orders under current filters
Total Profit
$1,665,816
100% cost coverage
Margin %
20.1%
Target 26.3% · Min 19.9% · Between minimum and target
Regions in Scope
7
96 customers across regions
Avg Order Value
$1,979
4,184 distinct orders
YoY Growth
2.8%
Same window last year
Revenue Delta vs Prior Period
$227,436
2.8% vs prior period
HHI (regions)
1,628
Top 1 23.3% | Top 5 80.9%
Regional Volatility ?
32.4%
Stability score 68
Repeat Rate
100%
Share of customers with repeat orders
Churn Risk Regions
0
High-risk regions needing attention
New Customer Share
Overview
Regional scale, mix breadth, and operating context under the active filters.
Revenue by Region
Horizontal ranking for fast comparison across long region names.
No regional revenue found for the active filters.
Operational Mix
Dominant shipping method plus supplier and product breadth by region.
| Region | Ship Mix | Suppliers | Products |
|---|---|---|---|
| Southeast | DC Ambient (29.7%) | 24 | 320 |
| Texas & Gulf | DC Ambient (30.1%) | 24 | 320 |
| Midwest | DC Ambient (27.8%) | 24 | 320 |
| Pacific | DC Ambient (29.4%) | 24 | 320 |
| Mountain West | DC Ambient (32.9%) | 24 | 320 |
| Mid-Atlantic | Direct Store Delivery (27.1%) | 24 | 320 |
| Northeast | DC Ambient (32.2%) | 24 | 319 |
Momentum
Current window vs immediately preceding equivalent window.
Top Gaining Region
Southeast
$454,653 (30.8%)
Top Declining Region
Midwest
-$456,929 (-28.0%)
Prior Period Status
Prior period available
Stable labels prevent low-base distortion.
Regional Momentum
Default sort is delta revenue. Use tabs to isolate gainers or decliners.
| Region | Revenue Current | Revenue Prior | Δ Revenue $ | Δ Revenue % | Orders Δ | Customers Δ | Profit Δ | Margin Δ (pp) |
|---|---|---|---|---|---|---|---|---|
| Southeast | $1,929,065 | $1,474,412 | $454,653 | 30.8% | 238 | 2 | $79,018 | -1.2% |
| Northeast | $730,934 | $593,006 | $137,929 | 23.3% | 39 | 1 | $16,473 | -2% |
| Texas & Gulf | $1,772,771 | $1,644,948 | $127,823 | 7.8% | 24 | 0 | $885 | -1.5% |
| Mountain West | $888,974 | $797,319 | $91,655 | 11.5% | 112 | 2 | -$761 | -2.4% |
| Mid-Atlantic | $852,387 | $850,067 | $2,319 | Stable | 58 | 1 | -$28,006 | -3.3% |
| Pacific | $934,426 | $1,064,440 | -$130,014 | -12.2% | -69 | 1 | -$40,764 | -1.5% |
| Midwest | $1,172,830 | $1,629,759 | -$456,929 | -28.0% | -237 | -4 | -$119,146 | -1.1% |
Profitability
Top regions ranked by the selected metric plus unit economics for operating decisions.
Regional Profitability
Switch between revenue, profit, margin %, and AOV.
No profitability data available for the active filters.
Unit Economics Highlights
Revenue per customer, profit per order, revenue per unit, and revenue per lb.
| Region | Rev / Cust | Profit / Order | Rev / Unit |
|---|---|---|---|
| Northeast | $104,419.21 | $496.30 | $102.79 |
| Texas & Gulf | $104,280.65 | $463.39 | $99.55 |
| Midwest | $68,990.01 | $446.03 | $103.77 |
| Southeast | $91,860.23 | $392.67 | $105.86 |
| Mountain West | $80,815.80 | $375.16 | $107.20 |
| Pacific | $77,868.84 | $362.73 | $103.30 |
| Mid-Atlantic | $77,489.70 | $256.23 | $107.82 |
Concentration
Dependency risk, revenue concentration, and quadrant-based regional prioritization.
Concentration & Dependency
Over-reliant regions where top customer or top product concentration is elevated.
Top 1 23.3% | Top 5 80.9% | HHI (regions) 1,628
| Region | Top Cust % | Top Prod % | Top Supp % |
|---|---|---|---|
| No over-reliant regions under current filters. | |||
Region Opportunity Matrix
X-axis = revenue. Y-axis = margin %. Quadrants use selected-region medians.
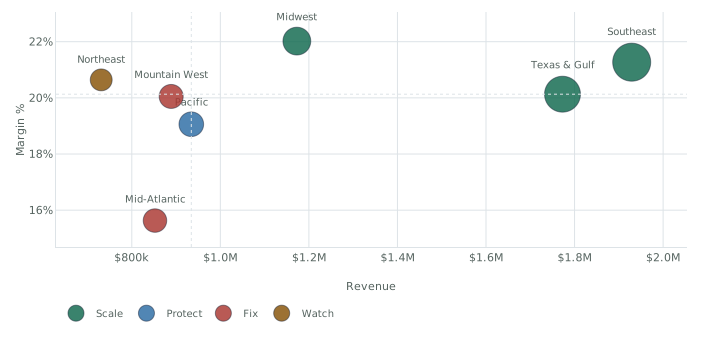
Scale
Protect
Fix
Watch
Not enough regions with revenue and margin data to render the matrix.
Retention / Risk
Repeat behavior, churn pressure, active customers, and action-priority watchouts.
Retention Health by Region
Repeat %, churn %, active customers last 30 / 90 days, and new vs returning mix.
| Region | Repeat % | Churn % | 30d / 90d Active | New % |
|---|---|---|---|---|
| Midwest | 100% | 5.9% | 16 / 16 | 0% |
| Texas & Gulf | 100% | 0% | 16 / 17 | 8.4% |
| Mountain West | 100% | 0% | 10 / 11 | 11.8% |
| Mid-Atlantic | 100% | 0% | 10 / 11 | 3.1% |
| Southeast | 100% | 0% | 21 / 21 | 21.5% |
| Pacific | 100% | 0% | 12 / 12 | 0.1% |
| Northeast | 100% | 0% | 7 / 7 | 8% |
Concentration & Risk Priorities
High concentration, low margin, high churn, negative trend, and weak coverage in one scan.
| Region | Risk | Summary | Δ Revenue | Quality |
|---|---|---|---|---|
| Pacific | Medium | Low margin, Negative trend | -$130,014 | OK |
| Texas & Gulf | Medium | Low margin | $127,823 | OK |
| Midwest | Medium | Negative trend | -$456,929 | OK |
| Mid-Atlantic | Medium | Low margin | $2,319 | OK |
Regions Table
Command table for drilldown, prioritization, and server-side filtered export.
| Region | Customers | Orders | Revenue | Profit | Margin % | AOV | Repeat % | Churn % | New Cust % | Top Cust % | Top Prod % | Δ Revenue $ | Δ Revenue % | Data Quality | Actions |
|---|---|---|---|---|---|---|---|---|---|---|---|---|---|---|---|
| Southeast | 21 | 1,045 | $1,929,065 | $410,337 | 21.3% Between minimum and targetTarget 26.3% · Min 19.9% · -5.1 pts vs target | $1,846 | 100% | 0% | 21.5% | 13.6% | 5.5% | $454,653 | 30.8% | LowOK | |
| Texas & Gulf | 17 | 770 | $1,772,771 | $356,813 | 20.1% Near minimumTarget 26.8% · Min 20.4% · -6.7 pts vs target | $2,302 | 100% | 0% | 8.4% | 16.4% | 4.2% | $127,823 | 7.8% | MediumOK | |
| Midwest | 17 | 579 | $1,172,830 | $258,251 | 22% Between minimum and targetTarget 26.8% · Min 20.3% · -4.8 pts vs target | $2,026 | 100% | 5.9% | 0% | 11.4% | 5.9% | -$456,929 | -28.0% | MediumOK | |
| Pacific | 12 | 491 | $934,426 | $178,101 | 19.1% Near minimumTarget 26.4% · Min 20% · -7.3 pts vs target | $1,903 | 100% | 0% | 0.1% | 27.6% | 6.5% | -$130,014 | -12.2% | MediumOK | |
| Mountain West | 11 | 475 | $888,974 | $178,202 | 20.1% Between minimum and targetTarget 25.8% · Min 19.5% · -5.8 pts vs target | $1,872 | 100% | 0% | 11.8% | 31.6% | 7.7% | $91,655 | 11.5% | LowOK | |
| Mid-Atlantic | 11 | 520 | $852,387 | $133,238 | 15.6% Materially below minimumTarget 25.4% · Min 19.1% · -9.8 pts vs target | $1,639 | 100% | 0% | 3.1% | 34.5% | 13.4% | $2,319 | Stable | MediumOK | |
| Northeast | 7 | 304 | $730,934 | $150,875 | 20.6% Between minimum and targetTarget 26% · Min 19.6% · -5.4 pts vs target | $2,404 | 100% | 0% | 8% | 31.2% | 7.1% | $137,929 | 23.3% | LowOK |
Showing 1-7 of 7
Exports
All exports are server-side and preserve current scope and global filters.
How to use this pageCompare markets on one operating basisRank regions, separate growth from concentration, then open the market with the clearest risk-adjusted opportunity.
1
Rank scale and changeStart with revenue, profit, and matched-period momentum.
2
Check qualityReview margin, retention, concentration, service mix, and data coverage together.
3
Open the regionUse View on the table to inspect customers, products, suppliers, and operating drivers.